 PR Resolution
Blog
Read things, learn things... do things better
Latest —
3 minute read
Don’t Let Good Media coverage go to waste! Get More Mileage Out of Your PR Wins
by Laura Joint
Securing coverage is no small feat and some pieces are harder to come by than others. That’s why I’m a big believer in squeezing every last drop out of each great piece of coverage that goes live. So I was thrilled to be joined by the brilliant Sarah Kissko-Hersh in a recent webinar, where she […]
Recent articles —
3 minute read
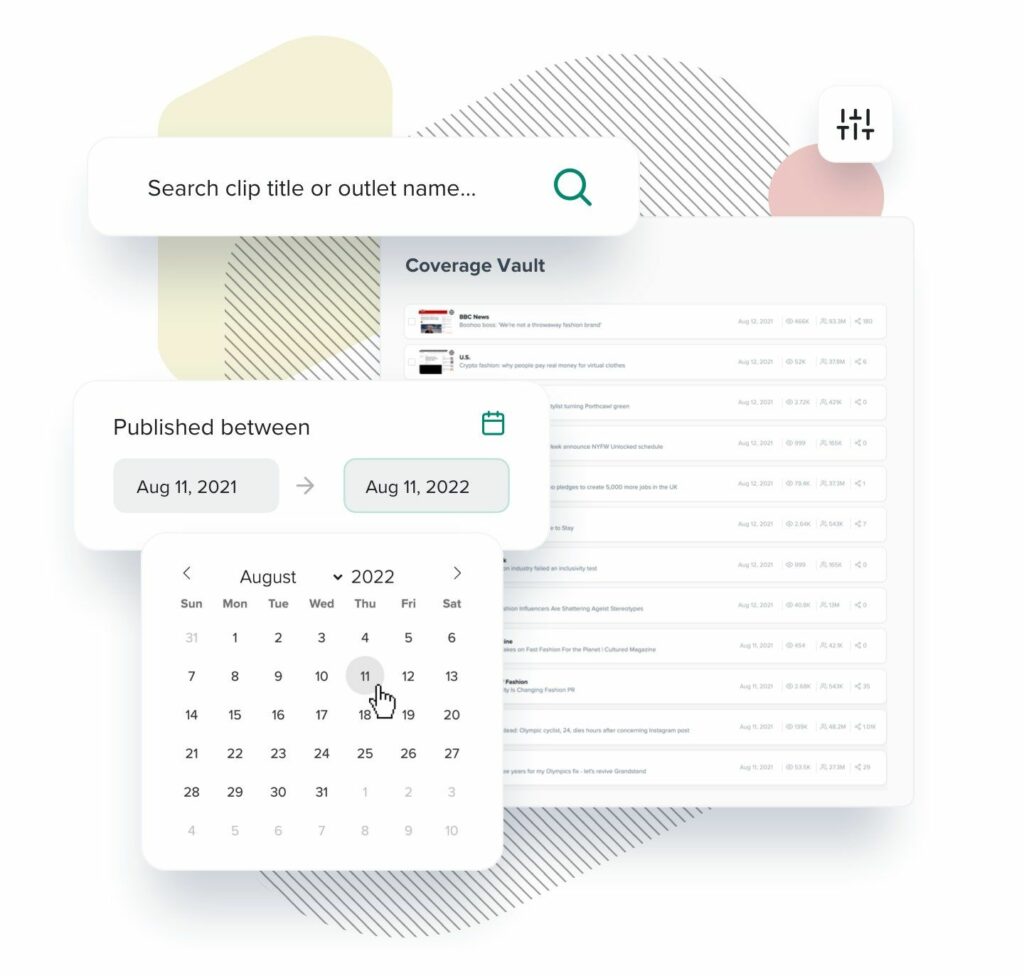
3 Powerful Ways To Use The CoverageBook Vault For Your Campaign Planning
by Laura Joint
“That is so awesome. I didn’t even know this Coverage Vault feature existed and I’ve been a customer for years!” No exaggeration. That’s the third comment from recent customer training calls where they had no idea there was this in-built coverage tracker feature as part of CoverageBook. They had no clue it existed! But loved […]
3 minute read
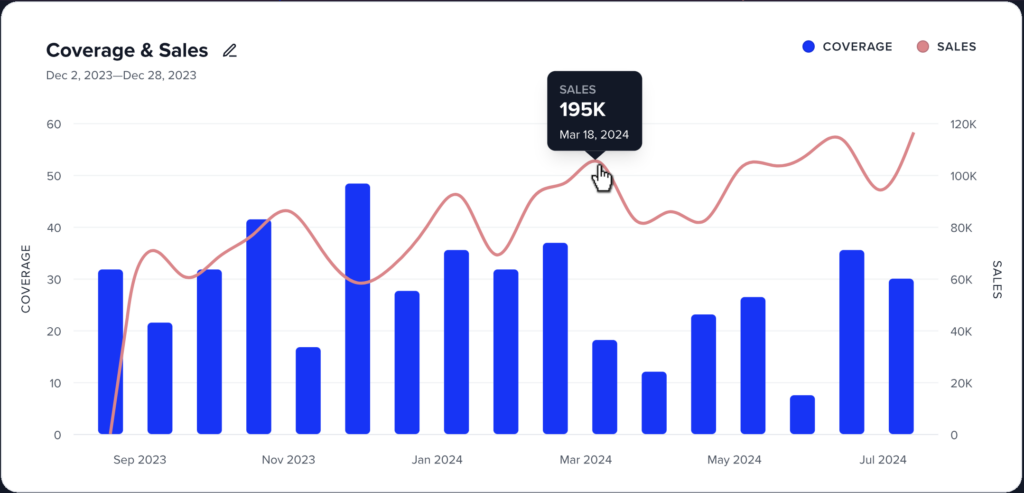
CoverageImpact. Visualise how your PR coverage impacts real-world outcomes.
by Gary Preston
Something is holding the PR industry back. It’s absence is known. But it’s starting to feel a little more serious day by day. Impact. The very thing PR can deliver. But few make an attempt to correlate their work with. Hitting targets. Cost savings. Leads. Donations. Sales. Stock Price. Employee Satisfaction. Staff retention. You know. Real […]

2 minute read
PR Value; How to calculate the efficiency of your PR campaigns through ‘CPM’
by Gary Preston
Dec 2023 update > We built a free-to-use PR Activity CPM Calculator. Try it out > In paid advertising where the goal is to raise awareness, one of the most commonly used advertising metrics is Cost Per Mille (also known as CPM), which measures the cost of every 1000 ad or media impressions. It is […]

4 minute read
PR Resolution Meets: Emma Lamberton from Coram
by Rebecca Fitzgerald
In this spotlight interview, we chat with Emma Lamberton – Senior Communications Manager at Coram, the first children’s charity, who shares some of the strategies and tactics that underpin their communications work. She provides valuable insights into how the charity has built its reputation as a trusted spokesperson for childcare-related issues through media commentary. Additionally, […]

3 minute read
How to tell your coverage success story and help secure your PR budget
by Hannah Harris
The PR industry is facing a financial squeeze right now. According to research by Provoke Media’s Influence 100, there has been a huge drop in PR budgets over the past 12 months – 1 billion dollars to be precise. And our latest podcast guest Chief Finance Officer Simon Collard, who has over 30 year’s experience, […]

9 minute read
Web Analytics and Traffic Terms for PRs and Marketers – A Simple Guide
by Rebecca Fitzgerald
Getting to grips with the weird and wonderful world of analytics terminology can be a real headache for even the most experienced PR person or marketer. Ever mixed up terms like users, visitors, visits, and views? It happens to the best of us. While these terms may sound alike, they all hold distinct meanings. So […]

4 minute read
A Beginner’s Guide: Adding Context to Your Reporting and Presenting PR Outcomes
by Gary Preston
“Are these numbers good? Or bad? Give me a clue!”“Why is that number so big? I don’t understand it. Or believe it.” “Should we be doing more or less of this?” A little glimpse into the mind of whoever you’ve sent your last coverage report to…. I’ve been thinking a lot about how we measure […]

4 minute read
PR Resolution Meets: Mark Taylor from The Ivors Academy
by Rebecca Fitzgerald
In our next installment of ‘PR Resolution Meets’, we speak with Mark Taylor, Director of Membership, Marketing, and Communications at The Ivors Academy. Mark emphasizes the importance of solid data and reporting in their day-to-day operations supporting their diverse community of songwriters and composers to grow their careers and achieve recognition. Understanding the context behind […]

2 minute read
Save $2k of PR budget every month (with a small adjustment to workflow)
by Stella Bayles
PR budgets are being reduced. Data gathered in June 2023 from the world’s 100 most powerful communicators found that there has been a drop in public relations investment in the past 12 months of more than $1bn, from $4.8bn to $3.7bn. This insight is taken from ‘The Influence 100’ which is PRovoke Media’s annual compilation […]

2 minute read
PR Resolution Meets: Ian McAllister from The Alnwick Garden
by Rebecca Fitzgerald
In this spotlight interview, we chat with Ian McAllister, Strategic Head of Marketing and Communications at The Alnwick Garden in Northumberland, England who shares insight into their proudest creative media campaigns. These include the launch of Lilidorei, the world’s largest play structure, which garnered extensive media coverage in outlets including the BBC and ITV, and […]

8 minute read
The best free and paid media monitoring tools for PR coverage in 2024
by Rebecca Fitzgerald
In a world where media rules and trends change faster than you can say “viral”, having access to the best media monitoring tools can be a secret weapon in staying ahead of your competitors. Monitoring tools not only identify valuable media mentions but can also be leveraged to provide insights into industry news, identify and […]
8 minute read
Can PR tech help improve data-literacy in your team?
by Stella Bayles
New data from our 2023 PR Data Literacy research; which surveyed over 400 PR and marketing professionals, shows that over half (57%) of respondents lack confidence in their data literacy skills, with a similar number (44%) stating they had previously presented a metric they did not fully understand. Responses from in-house professionals reflect this knowledge […]

5 minute read
PR Resolution Meets: Margo Neely
by Hannah Harris
In the first installment of our new series: ‘PR Resolution Meets’, we chat to Margo Neely, Chief Creative Officer at Neely and Daughters. Margo’s work first caught our eye when we were introduced to The Neely Air 808 Sneaker – a brilliant creative fusion between sport and entertainment, in which Margo designed a pair of […]

2 minute read
Five brands that are smashing it with Spotify playlists
by Hannah Harris
We’ve just added Spotify playlists to our coverage stack. You can now copy and paste a playlist link into CoverageBook, and we’ll collect the playlist’s number of followers, and its combined total of likes and shares on Twitter, Facebook and Pinterest. This means you can also show ‘Spotify likes’ in your metric summary too. So […]
3 minute read
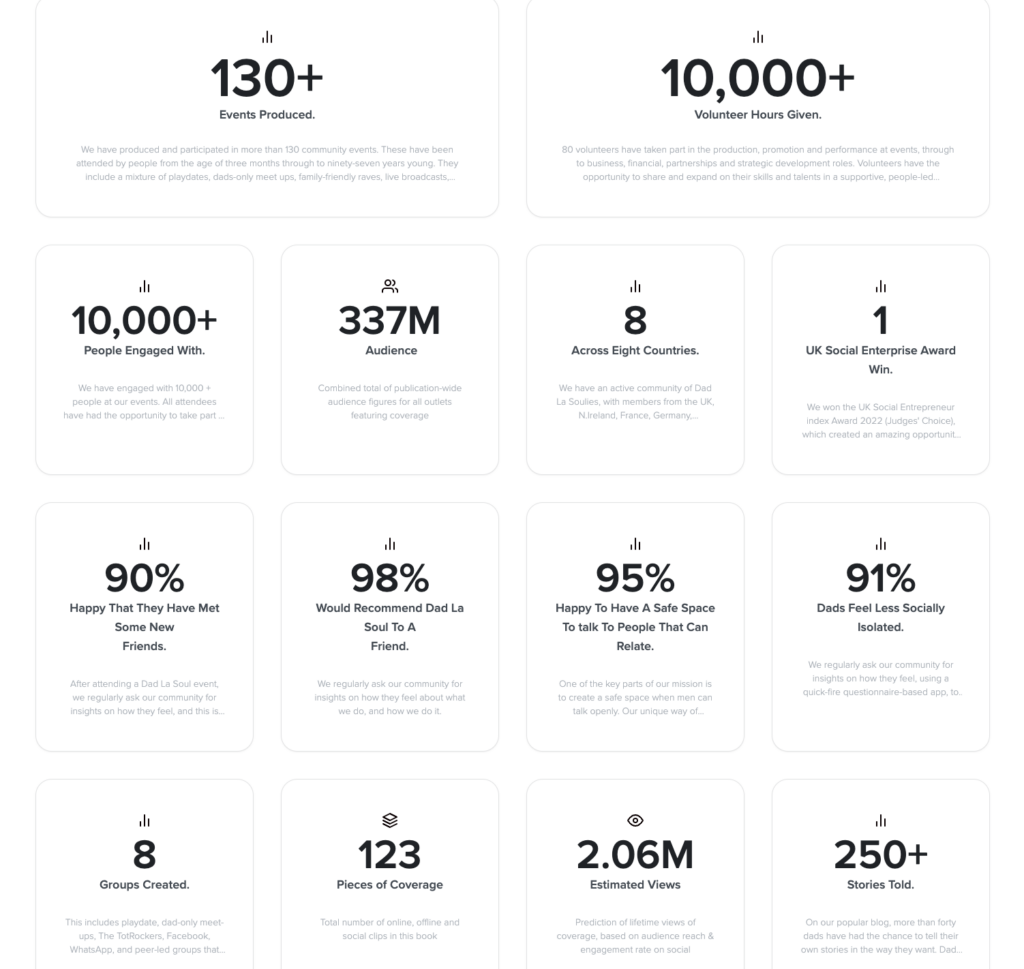
How to turn a PR coverage book into a ‘social impact report’ 
by Stella Bayles
Estimated coverage views, social shares and engagements are all metrics most PR people are familiar with, but when we recently saw them alongside stats on social isolation and ‘no. of friends made’ we needed to know more! Who was this report for? What job does it do? How was it customised? Was it a success? […]

6 minute read
Attribution in a PR Context – What All the Confusing Terms Mean
by Laura Joint
Great news; you’re working with the analytics guys or co-reporting with the digital team or learning more about marketing measurement… The bad news; you’re hit with language you’ve never heard or know what it means! We get it. It’s not always appropriate to stop meetings and ask for definitions and let’s face it, even though […]
2 minute read
How to successfully communicate PR results and make an impact
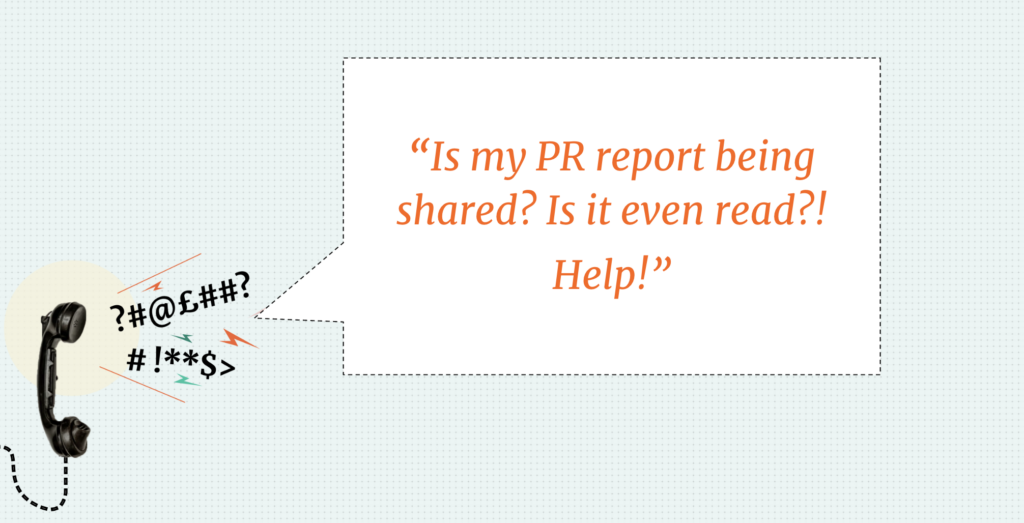
by Stella Bayles
Modern PR can impact an organisation on many levels. A wider variety of stakeholders now take an interest in PR results than ever before, however there is often a fear among PR teams that once a report is sent, it might not be read! We ran this webinar to help you understand your PR report […]
3 minute read
What’s new in CoverageBook 2?
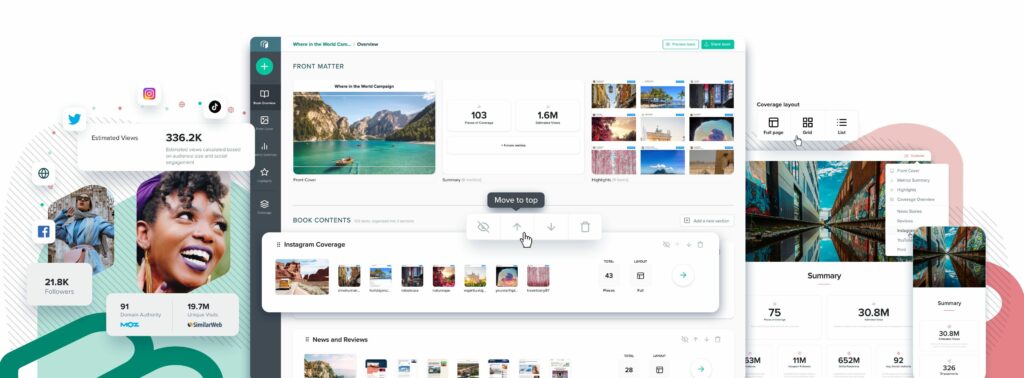
by Stella Bayles
Since we launched the new platform in November we have been listening to your feedback and made multiple improvements and new features in CoverageBook. You’re busy, we know you don’t have time to read about every single update. But for all the bigger changes that will make your life easier, we are adding them […]
1 minute read
How to measure social coverage in 2022
by Stella Bayles
There are now multiple metrics available as a way to measure PR coverage on social platforms, but which should take priority and how do you compare and analyse alongside media coverage? CoverageBook co-founder, Stella Bayles was joined by coverage analysis expert, AMEC member and founder of Experienced Media Analysts, Steph Bridgeman to find out. This […]