We’re about to launch something. It’s exciting. So we’re going to tell people about it. Using PR. I know right?!
We’re getting our ducks in order to make sure we’re measuring all the right things. I’ll write up a bigger post detailing all this very soon. Hopefully, you’ll find it useful.
But for now I wanted to share a quick tip on one easy way (certainly not the only way!) we’ll be measuring the impact of our own investment into PR around the launch.
One objective of our PR campaign will to build our profile in the US. Our largest market for customers already. But we think there is room to grow.
The Hypothesis…
Media & influencer coverage in the US will lead to an increase in the number of people searching for our brand in the USA using Google.
How?
I’m a fan of search data. And in this case the Google Webmaster Central performance report. It’s going to let me measure any incremental lift in brand traffic as a result of our investment into PR.
1. Get access to Google Search Console (formally Webmaster Central ) for your brand.
I know. Easy for some. Impossible for others. If you can’t, try and find out who does have access and say you’re looking to measure the impact of your work. They’ll like that. If not then shame them (nicely).
2. Play with the “Performance” report.
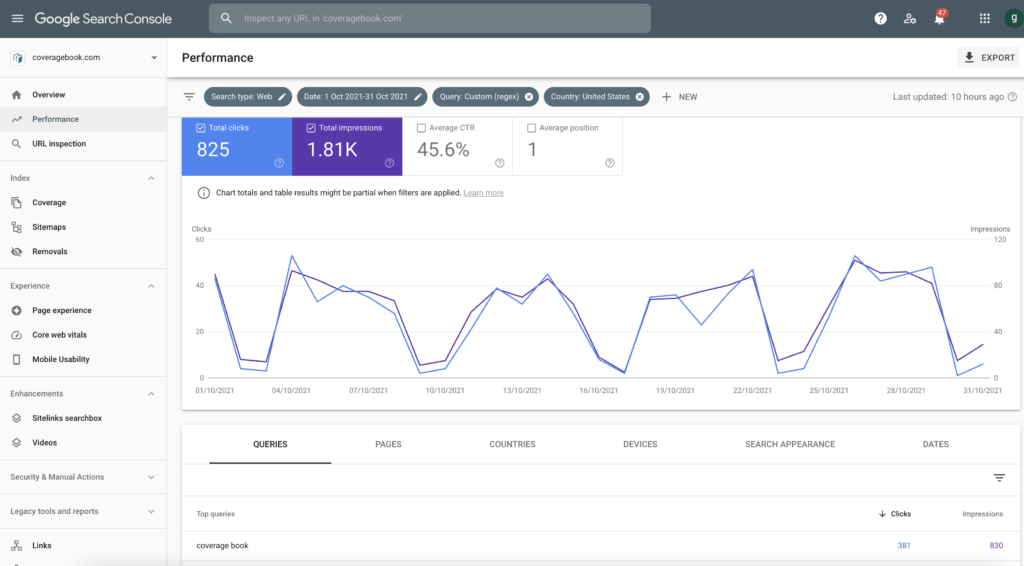
The “Performance” view lets me create filters on how our website “CoverageBook.com” performs in Google search. I’m getting a barometer on where our website is listed on a Google search results page for various search queries.

3. Setup the filters properly
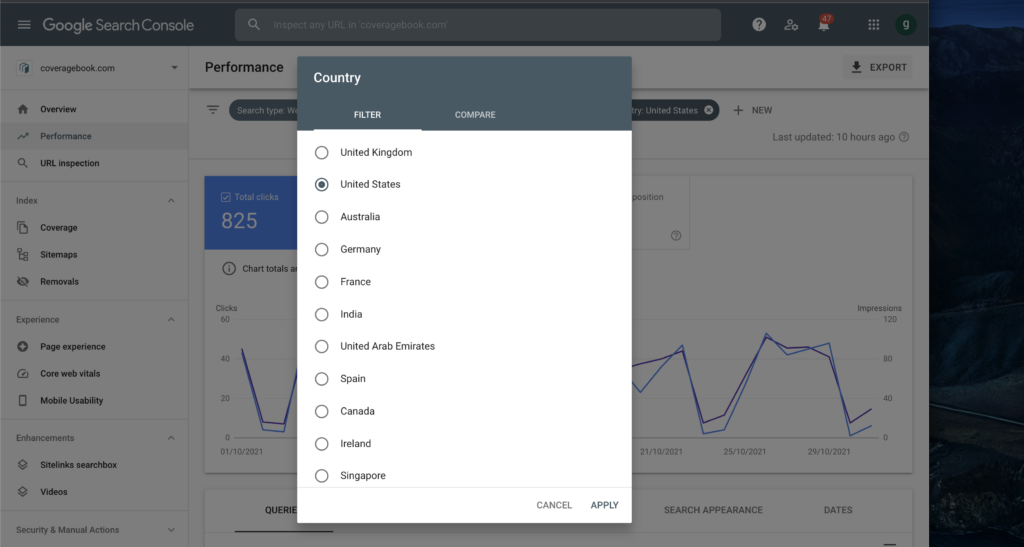
This is a proactive US-focused PR campaign. So I want to get a benchmark on how people search around our “brand” in the USA now. So I can measure if post the $$ we’re investing I can see some impact! Luckily I can simply filter to this country only.

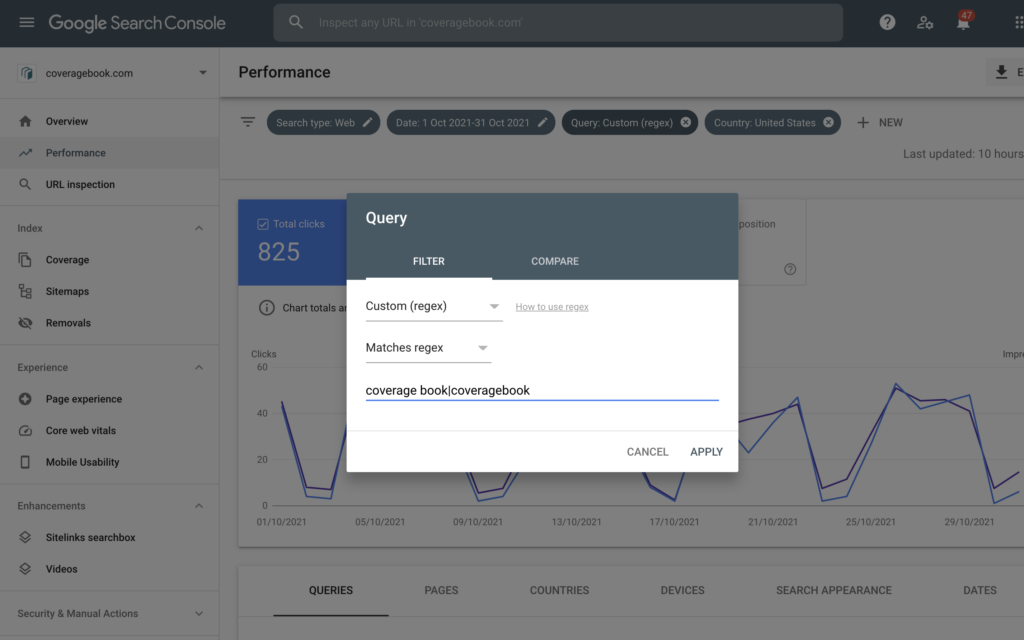
I then need to define which keywords people might type in as our “brand”. I know I know. CoverageBook is not the most obvious example here. But for us here is the filter I used. Remember this analysis does not need to be perfect! Just benchmark and observe change.

4. Behold. Your “brand” search benchmark data.
I can now see how many times our website appears in Google (US) when people search for variations of our brand “CoverageBook”. I can see both the “impressions” and “clicks” data.
i.e. The number of times (impressions) a search like CoverageBook happened in a month. And also how many times somebody clicked on our result (website) when perusing their Google results page.
5. Add a bookmark to this page so you don’t need to set it up again!
And that is that. For now.
6. Hold your breath and wait for the PR campaign to kick in.
We’re close. And lots of work has gone in. But pitching has only just begun. And no coverage is live yet.
But when (and if?!) it does then I’ll be looking to see if the coverage caused an increase in clicks/impressions in the US for our defined “brand” searchers.
As we have a benchmark report setup we’ll be able to assess if as a result of the investment we saw any incremental uplift in brand traffic in the US. With pretty good numbers to hand.
7. Retrospective Analysis
In a few months time (my calendar reminder is set already) I’ll be taking a snapshot of that graph. And annotating it with key dates of US coverage landing. And the subsequent lift in brand searchers. We’ll be drunk and care free high fiving at our marketing genius. Or at least that is the plan. We might be looking at no change at all. Which will teach us something. So all good in my book.
Anyway, let’s see.
I’ll follow up on this post at a later date. Along with more detail on all the other ways we’ll be measuring the impact of our work. Practise what you preach right?!
Hope that was useful. Let me know over Twitter.
