It’s new year and we want 2018 PR campaigns to be award winners. The best way to do this is by setting KPIs (key performance indicators).
However if all we do in this situation is just up the KPI number slightly from the previous year then we shouldn’t expect a great deal to change.
If you really want 2018 an award winning year you need to invest a little time in PR analysis.
Before you think ‘analysis sounds difficult and boring’ don’t fear! I have three easy steps to help you and you’ll be a PR analyst before you know it.
Step one: Choose the right metric
Setting KPIs can be a challenge as it’s difficult to know how to increase the target. It’s important to look at your upcoming activity and relate back to similar work in the past.
Once you’ve found coverage from similar activity review why it was a success and the metrics that demonstrated that.
Here’s an example;
2018 activity? Content creation activity plus a media sell in
2017 activity to review? Look for psst coverage that included campaign content
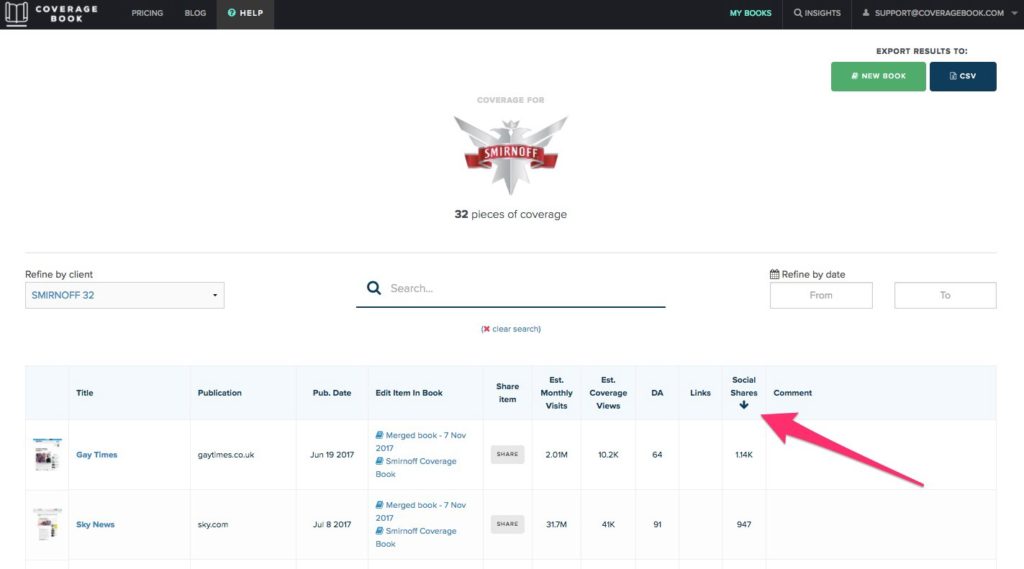
Look out for the metrics that stood out on that coverage. It’s likely to be social shares.
2017 Metric to take forward to 2018? It should be social shares with guidance on the share number.
High social shares of coverage indicate that an article was engaging to the reader and has given them a reason to share it with their peers.
Shares of your coverage aren’t just great for awareness. The social votes also signal to Google that your coverage is popular. This can result in your coverage being featured in Google search results.
It’s therefore essential to understand why the shares differ and why one article has worked better in one campaign in comparison to another.
Ask yourself: What was the supporting campaign content that featured in past coverage?
Interesting content in addition to images and words are often the differentiator between somebody sharing an article or not — did yours have those elements? What elements should be added to the 2018 strategy?
You can dig a little deeper here and find out more about the type of content people love to share. By looking at Jonah Berger, author of ‘Contagious’ for example. He has some great guidance on what makes content shareable and this totally applies to coverage as well as owned content.
Once you have a better understanding of how you should adapt your creative approach you can set an increase in the shares based on your target media list.
Social shares are just one metric however it’s an important one to that particular activity. I recommend being specific and niche in KPIs rather than having lots that are generic. This will improve performance and you will feel the impact.
Step two: Record and review
Reviewing metrics of past campaigns is important. Not just to draw insights for your stakeholders but also for you to set better strategy and creatives too. But reviewing data isn’t easy so I recommend making it easier for yourself this time next year by recording it well in 2018.
As campaigns differ in components and approach it’s a good idea to track a variety of metrics over the year. That way you have all options for future KPIs.
Here are a few suggestions for metrics and components to track:
- Date of cutting
- Headline
- Publication/source
- Publication estimated traffic (I recommend similar web)
- Social shares
- Domain Authority
- Messages conveyed
- Spokesperson mentioned/quoted
Recording your coverage data in a spreadsheet is useful. It’s the best way to review and draw out insights post campaign.
PR analyst Steph Bridgeman wrote a helpful post on how to refine coverage metrics in spreadsheets here. It’s ace. Steph provides a step-by-step guide to cutting andrefining your coverage data.
You could also use a tool I work on CoverageBook to do a similar job. It works as a great alternative to excel and Google sheets for coverage data as it automates metrics.
Step three: Create the master of all media lists
Reviewing a media list is always on a PR team’s ‘to do’ list, however, it can be de-prioritised as it’s often considered an exercise to simply update contact details. It’s actually far more important than that.
By reviewing past coverage and drawing key insights such as publication placement, social shares, coverage views and influence scores, you’re able to refine target lists and have a higher chance to connect with them.
After reviewing your previous campaigns and analyzing the results you could find that your top-tier targets are no longer a priority and equally may be overlooking important influencers.
Compile contacts
A PR team I know recently analysed 1200 items of past coverage and found that they had featured on the Guardian news site 90 times. They knew the Guardian was an important publication but what they hadn’t realised before analysing their coverage was that one particular journalist had written about their brand more than 30 times.
This was an insight that previously would have been overlooked. They were able to act on this by building a better relationship with the influencer and that resulted in a wider brand project.
Prioritise publications
Another great way to ensure you have the right publications in your target list is by prioritising by influence, this is where the ‘domain authority’ score can be a PR professional’s best friend.
A Domain Authority (DA) score (developed by MOZ) tells us how strong the site is that our coverage is on and how influential it may be in search results such as Google.
The higher the DA strength, the bigger the chance our coverage and content will have in reaching the big Google audience so tracking this score in past coverage and then use it to prioritise our media lists can be very powerful.
The DA score is out of 100. Here’s a rough guide to what the scores mean:
1–19: That’s low… (Note: it might be that the site is brand new.)
20–29: Pretty average (see above.)
30–39: That’s good and will pass on SEO benefit to your client’s content
40–59: A strong site (see above)
60–80: A very strong site
81–100: Awesome! Your campaign content should have more visibility if it’s linked to from coverage.
As a publication is updated and becomes more popular online you will notice the DA score increase so it’s a great way to prioritise publications.
You can check DA score by using the ‘open site explorer’ tool from Moz.com and adding the scores direct to your spreadsheet media lists. Working from a shared GoogleSheet for this can be useful as it means multiple team members can work from the sheet at the same time and scores can be updated and seen in real-time.
Following those three steps will help you plan a strategy, target list and set KPIs that will make a real difference to your organisation.
Happy new year!
If you want to hear more watch the recording of my FREE WEBINAR here: http://bit.ly/2018KPIsPR Resolution
