
We’ve all heard the saying “any publicity is good publicity”, but anyone working in PR knows this couldn’t be further from the truth.
Let’s face it… getting loads of coverage is the holy grail for us PRs.
But if this is all negative, it will do more damage than good.
This is where measuring the sentiment of coverage becomes really useful. It gives context to your coverage and helps determine what kind of message is being published about your brand, product, or campaign.
But, because sentiment is such an intangible thing, it’s tricky to track — it’s like trying to determine someone’s deepest, darkest emotions just from their facial expression. The way one person sees it might not be the way another person does. This is why it’s not enough to just pop each piece of coverage into a positive or negative pile.
Instead, you need to decide on a methodology that your entire team can use that’s consistent, otherwise the results become meaningless.
So where do you start?
1. What Are Your Needs?
First of all, you need to work out how sentiment analysis will be most useful for your organisation. Take a look at your goals and determine how measuring sentiment fits into that.
This may sound obvious, but different situations will change what may be seen as good coverage. For example, if you’ve been hammered with negative press recently, are you trying to balance that out with more neutral coverage? Or are you simply trying to secure favourable coverage to boost your brand exposure?
Steph Bridgeman, founder of Experienced Media Analysts, who has worked on thousands of qualitative earned media measurement programmes over the past 20 years warns that context is really important: “A company or organisation may see it as favourable if media reports its strong cashflow position. A charity for example, based solely on donations with no public funding, would not necessarily find it favourable to see reports of its strong cash reserves in the media as this may discourage fundraising. This is why it is important to set out or codify guidelines in advance to be clear on what favourable means.”
“Another good example is government communications campaigns. These are often focused on conveying key messages and changing behaviours. News content for these campaigns rarely contain descriptive words about the government agency or viewpoints on the campaign per se. This type of coverage is more likely to be neutral in sentiment in its purest sense. Yet delivering these messages can be considered ‘favourable’ by the client — it is important to have these kinds of discussions at the briefing stage.”
2. Choose Your Weapon of Choice (a.k.a. Which Sentiment Scale to Use)
There are a number of different sentiment scales doing the rounds, but it’s up to you to choose which one works best for your needs.
You may decide to go for a positive, neutral, or negative framework, or you might decide to use a points scale to put numbers to your findings.
In our recent podcast on sentiment analysis, Maya Koleva, Head of Insight at Commertric explains how the four-point scale is growing in popularity. This scale measures coverage as positive, negative, neutral, or balanced. “Balanced” refers to coverage that contains both positive and negative elements which cancel each other out.
Alternatively, you can go for a points system and plot your coverage as a number, whether it’s between 1–10, 1–100, or even -100 to +100.
If you use a numbers-based scale, Steph highlights you can also work on net sentiment, which takes the percentage of unfavourable coverage away from the favourable. So, if you receive a lot of neutral coverage, your net sentiment would be a low net sentiment number.
3. Consistency is Key
It’s important that your whole team understands the sentiment scale you’re using and how to plot what each type of coverage looks like.
So, when you’ve agreed on a scale and a direction, you then need to agree on what each type of sentiment looks like — what does a positive piece of coverage look like? What about a negative piece or something that’s balanced? What kind of coverage would get a 10 on the scale and what would get a 1?
It’s also important to consider how you’re going to keep consistency the same over time and across team members. You can create a document (or an infographic like the one below) that outlines what kind of content fits into each sentiment analysis category.
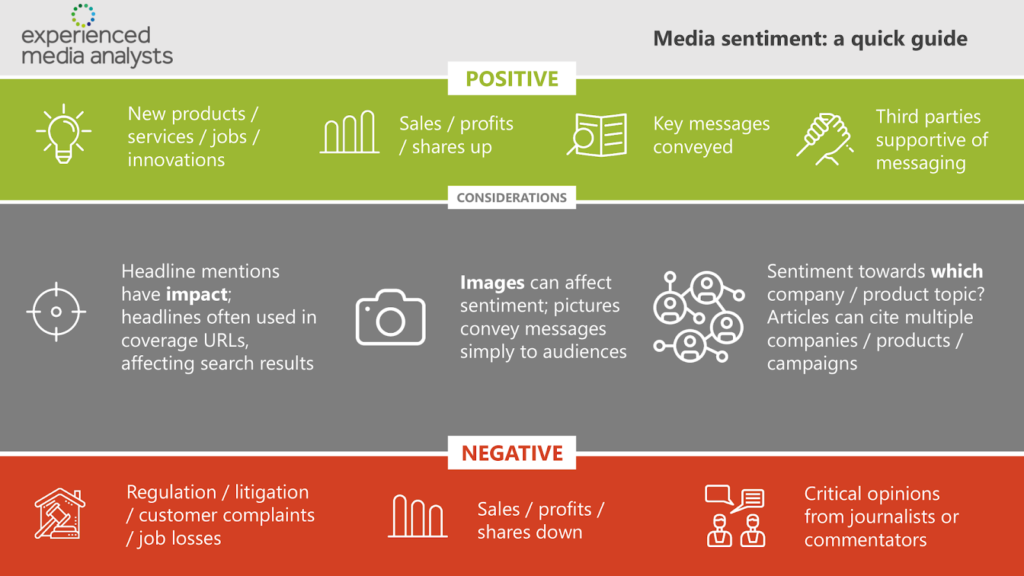
Having a piece of collateral like this means team members can analyse their coverage with a quick glance.
4. Agree What to Analyse
Now that everything’s in place and everyone knows the deal, it’s time to start analysing your coverage.
This can be pretty simple for short pieces, but if you’ve landed coverage on a two-page spread or somewhere that focuses on long-form content it can help to break things down and analyse each section. You may decide to give a score to each segment and add it all up to get your overall sentiment score.
For example:
- The URL of the coverage (this is important because it gets shared on social media and is often the first thing people see)
- The headline of the coverage
- The first paragraph
- The main paragraph (or main paragraphs)
- The graphics and imagery within the coverage
- The reader comments if there are any
There are other elements to think about here too, like product or topic-level sentiment. For example, an article can be neutral or balanced overall, but it might talk about a topic or a particular product in a positive light.
5. Ready, Set… Analyse
It’s a good idea to start with a spreadsheet of your coverage that includes other details such as the date and the reach of each article. Then, once you have the article level sentiment on a spreadsheet, you can pivot by any other metric, like:
- Sentiment over time
- Sentiment by reach/impressions etc
- Sentiment by company
- Sentiment by product
- Sentiment by source name
- Sentiment by journalist
- Sentiment by spokesperson
And so on… the possibilities are endless!
CoverageBook customers can take advantage of the ‘download CSV’ function to download the metrics of their coverage set which forms a good basis to layer sentiment on top.
6. Context is Everything
Once you’ve analysed your coverage, you’ll have some kind of score that measures on your chosen sentiment scale.
However, it’s no good having this standalone score if you’ve got nothing to compare it to. So, for this step, you’re going to want to get further context around what good coverage looks like in general.
This might mean you analyse a competitor to set a benchmark and determine how your coverage compares against theirs. Or it might mean you start tracking sentiment scores over time to see if the sentiment is improving or not. It’s at this stage you’ll be glad of the spreadsheet where you can pivot by different metrics. Once you have been tracking sentiment for a while, you can also start setting future sentiment goals.
Sentiment analysis can take a lot of time, which has led to the birth of several companies that can help you figure it out. On top of this, some companies are using AI technology to train machines to understand the sentiment of coverage.
To learn more about the advancements in this area and to explore sentiment analysis in more detail, head over to our Podcast, PR measurement: Sentiment analysis explained, with sentiment experts Steph Bridgeman, head of Experienced Media Analysts, and Maya Koleva, head of Insight at Commetric.
