Publication Benchmarks: How Does Your Coverage Compare?
A few weeks ago we launched our 2025 benchmarks data report, crunching the numbers on the six million URLs submitted to CoverageBook during 2024. The report provides context around what good looks like for our customers, how likely they are to secure coverage in high Domain Authority news outlets, and what typical levels of engagement coverage receives. If you missed our webinar to accompany the launch of this report, catch up via our YouTube channel.
But what does good look like at a publication level? What’s the average level of social shares for a piece on the Daily Mail for example? We focused our lens on a list of some of the biggest global news outlets to find out more.
We start with a deep dive into some of the UK’s biggest online news outlets: the Daily Mail, The Guardian, BBC online, and because I am based in the North-West of England, the Manchester Evening News.
We also explored data submitted by customers for two of the most influential US titles, The New York Times and Wall Street Journal, and supplemented this with other high audience international news titles: Forbes, MSN and Yahoo!
Daily Mail
The Daily Mail has a high domain authority: 94. Achieving coverage in a title such as this can help push up your average DA for a campaign.
A piece in the Daily Mail can achieve 250k-414k estimated coverage views (ECVs), which averages at 301k ECVs.
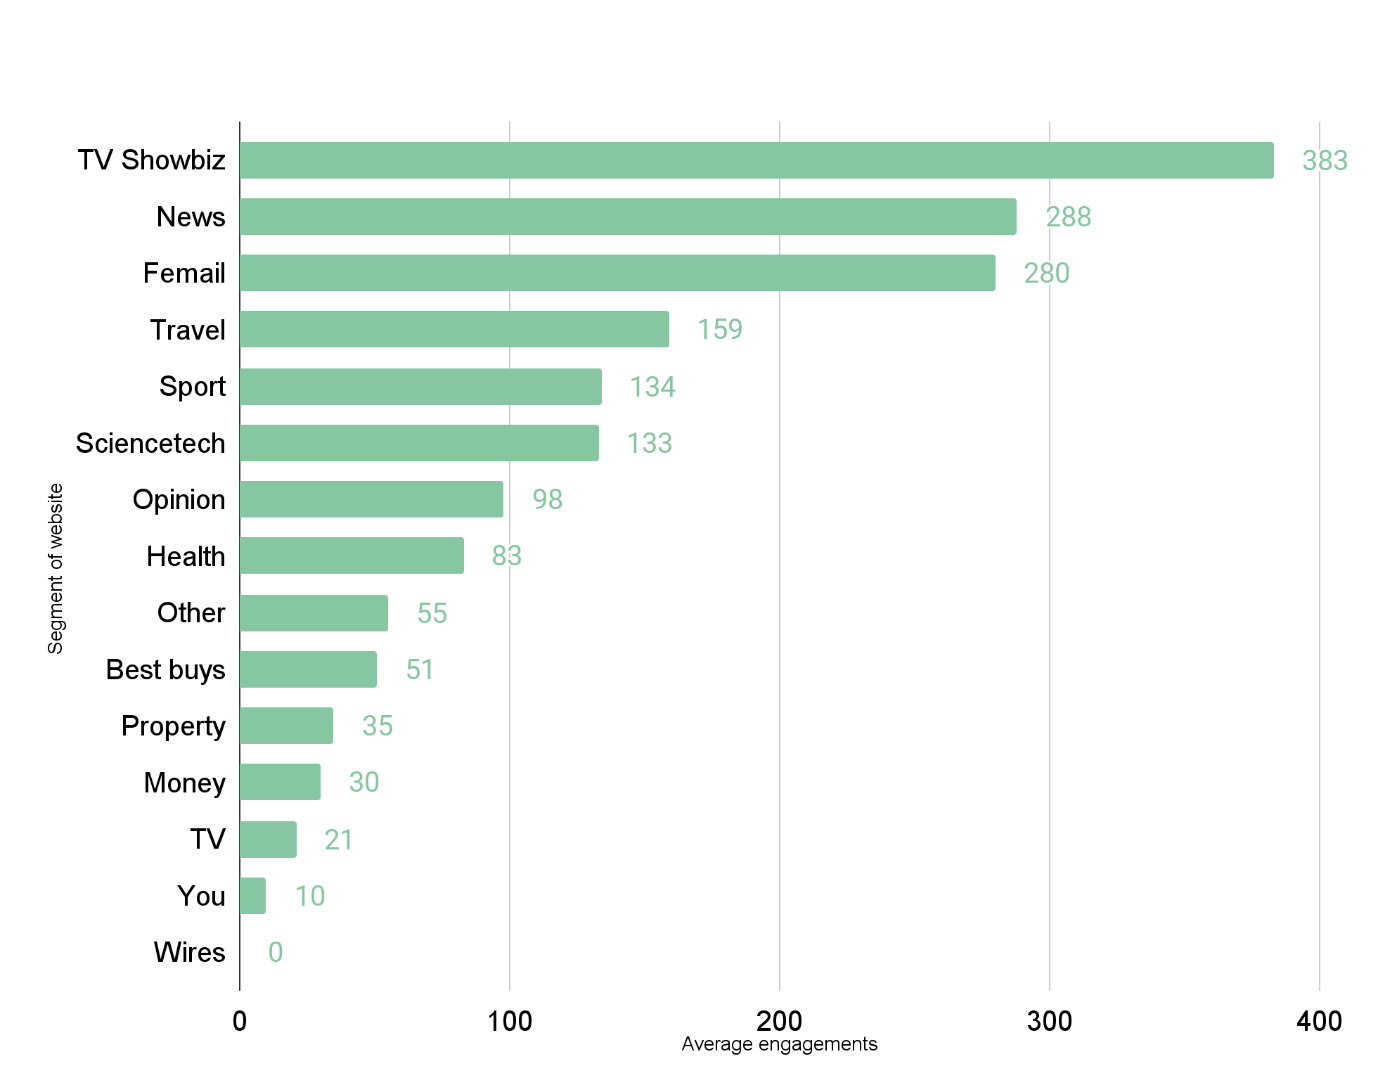
Articles from the property, money, sport and science/tech sections generate higher ECVs on average than articles from the TV, You Magazine or opinion sections.
Coverage from the Daily Mail’s ‘sidebar of shame’ TV Showbiz section is most likely to receive the most social shares, followed by news and articles from the Femail segment.
Do you ever submit Daily Mail syndicated wire coverage provided by newswires such as Press Association, Associated Press and Reuters? These articles are harder to find on the Daily Mail website, and data demonstrates that this type of coverage does not receive social amplification – which begs the question, is anyone really reading it?
Average social engagements per segment: Daily Mail
How many social shares of your coverage?
Out of 13.3k items in Daily Mail, what % gets this many social shares?
If you get this you are in the top…
0 shares
29.84%
1 to 9
17.97%
70.16%
10 to 19
9.87%
52.19%
20 to 29
7.38%
42.32%
30 to 39
6.06%
34.94%
40 to 49
4.52%
28.87%
50 to 59
2.51%
24.36%
60 to 69
2.06%
21.85%
70 to 79
1.91%
19.79%
80 to 89
1.30%
17.88%
90 to 100
1.24%
16.58%
101 to 150
3.53%
15.34%
151 to 200
2.24%
11.82%
201 to 250
1.34%
9.58%
251 to 300
0.98%
8.24%
301 to 350
0.68%
7.26%
351 to 400
0.67%
6.57%
401 to 450
0.47%
5.91%
451 to 500
0.38%
5.43%
501 to 1000
2.04%
5.06%
1001 to 10k
2.55%
3.02%
>10k
0.47%
0.47%
The Guardian
The Guardian has a DA score of 94.
On average, a piece from this website prompts ~279k views.
Guardian coverage is more likely to be shared than other news sites – if you have received 1 or more shares, this places you among the top 92% of performers.
How many social shares of your coverage?
Out of 4,426 items in The Guardian, what % gets this many social shares?
If you get this you are in the top…
0 shares
7.57%
1 to 9
9.56%
92.43%
10 to 19
9.22%
82.87%
20 to 29
7.39%
73.66%
30 to 39
5.94%
66.27%
40 to 49
4.90%
60.33%
50 to 59
3.75%
55.42%
60 to 69
4.02%
51.67%
70 to 79
2.82%
47.65%
80 to 89
2.96%
44.83%
90 to 100
2.51%
41.87%
101 to 150
7.37%
39.36%
151 to 200
5.33%
31.99%
201 to 250
3.86%
26.66%
251 to 300
2.82%
22.80%
301 to 350
2.21%
19.97%
351 to 400
1.69%
17.76%
401 to 450
1.65%
16.06%
451 to 500
1.36%
14.41%
501 to 1000
6.26%
13.06%
1001 to 10k
6.42%
6.80%
>10k
0.38%
0.38%
BBC News:
The BBC website has a high domain authority: (95 for BBC.co.uk and 94 for BBC.com). Achieving coverage in a title such as this can help push up your average DA for a campaign.
CoverageBook customers were most likely to upload coverage from the news section of the site, followed by BBC Sounds which hosts its radio and podcast content. This shows the importance of audio communications in an integrated comms campaign.
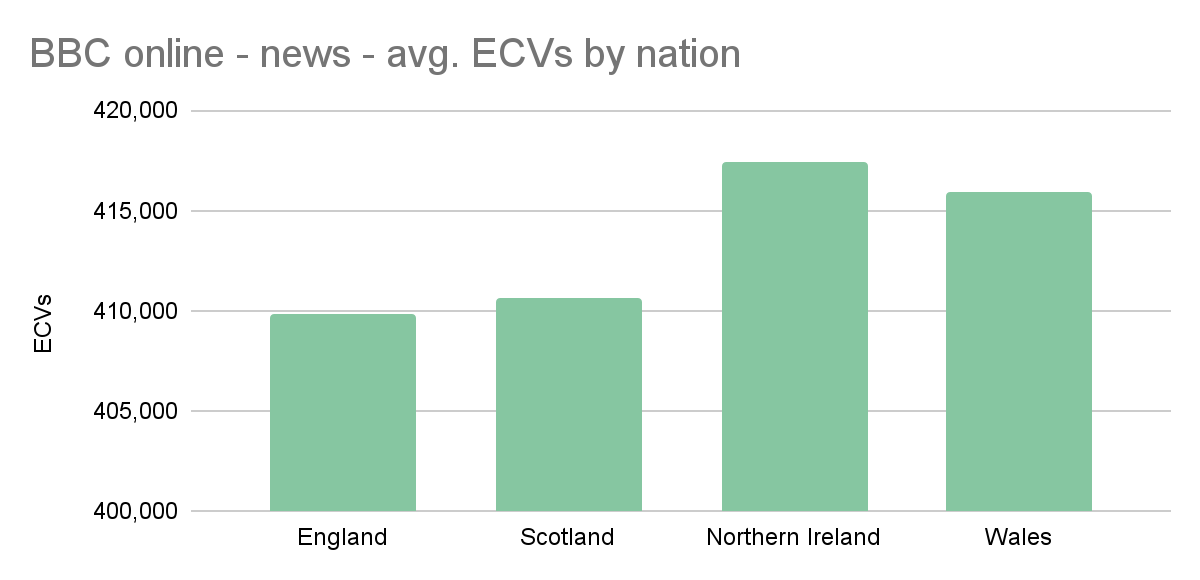
News from the BBC site receives an average reach of 426,691 ECVs and an average of 489 social shares.
News posted on the regional segments (England, Scotland, Wales, Northern Ireland) has a slightly lower average reach – 409,829 for England, 410,596 for Scotland, 417,404 for Wales and 415,917 for Northern Ireland. Notably, the volume of news submitted from the England segment was substantially higher than the other nations (78% of local BBC news coverage was from here) but articles posted in the Northern Ireland and Wales segments of the site perform slightly better on reach. Are the other nations of the UK more engaged with local news than the English?
The table below shows typical ranges of coverage with social shares (focusing only on the news segment of the BBC website)
How many social shares of your coverage?
Out of 3,198 items in the news section of BBC online, what % gets this many social shares?
If you get this you are in the top…
0 shares
16.29%
1 to 9
9.88%
83.71%
10 to 19
7.25%
73.83%
20 to 29
6.29%
66.57%
30 to 39
4.91%
60.29%
40 to 49
4.19%
55.38%
50 to 59
4.03%
51.19%
60 to 69
3.97%
47.15%
70 to 79
2.66%
43.18%
80 to 89
1.69%
40.53%
90 to 100
2.35%
38.84%
101 to 150
7.13%
36.49%
151 to 200
4.75%
29.36%
201 to 250
2.97%
24.61%
251 to 300
1.94%
21.64%
301 to 350
1.91%
19.70%
351 to 400
1.47%
17.79%
401 to 450
1.28%
16.32%
451 to 500
1.31%
15.04%
501 to 1000
6.00%
13.73%
1001 to 10k
7.07%
7.72%
>10k
0.66%
0.66%
Manchester Evening News:
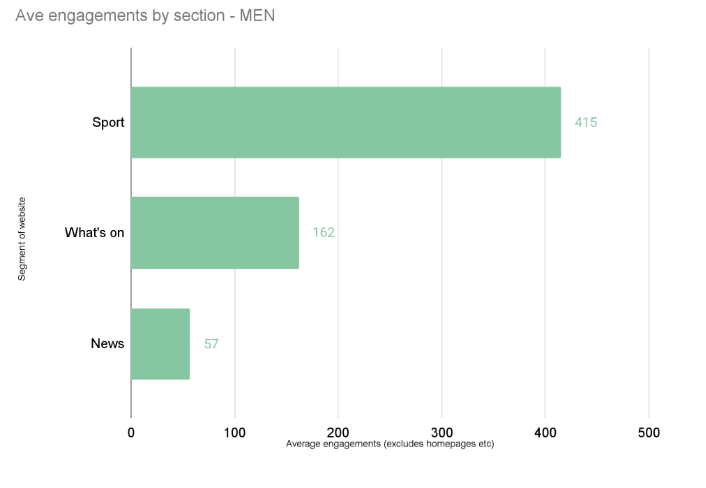
The Manchester Evening News is a regional newspaper serving one of the UK’s biggest cities.
Home to two of the world’s leading football / soccer teams, it is no surprise that coverage from the sport segment of the site is most likely to receive engagement on social media.
~22% of coverage from this site receives no social shares.
How many social shares of your coverage?
Out of 2,602 items from the Manchester Evening News, what % gets this many social shares?
If you get this you are in the top…
0 shares
21.87%
1 to 9
18.91%
78.13%
10 to 19
7.30%
59.22%
20 to 29
5.53%
51.92%
30 to 39
4.77%
46.39%
40 to 49
4.15%
41.62%
50 to 59
2.81%
37.47%
60 to 69
2.57%
34.67%
70 to 79
1.84%
32.09%
80 to 89
1.69%
30.25%
90 to 100
2.00%
28.55%
101 to 150
6.38%
26.56%
151 to 200
4.19%
20.18%
201 to 250
2.61%
15.99%
251 to 300
2.54%
13.37%
301 to 350
1.46%
10.84%
351 to 400
1.84%
9.38%
401 to 450
1.00%
7.53%
451 to 500
0.81%
6.53%
501 to 1000
2.81%
5.73%
1001 to 10k
2.84%
2.92%
>10k
0.08%
0.08%
Wall Street Journal:
The Wall Street Journal has a high Domain Authority score: 94.
An average piece from this site might achieve ~78k views.
More than half of coverage submitted from this website does not receive any social shares.
Beyond the news section, lifestyle, health and personal finance coverage performs well in terms of average engagements.
How many social shares of your coverage?
Out of 1,590 items in The Wall Street Journal, what % gets this many social shares?
If you get this you are in the top…
0 shares
56.67%
1 to 9
9.43%
43.33%
10 to 19
2.96%
33.90%
20 to 29
3.21%
30.94%
30 to 39
2.08%
27.74%
40 to 49
1.95%
25.66%
50 to 59
1.45%
23.71%
60 to 69
0.88%
22.26%
70 to 79
1.64%
21.38%
80 to 89
1.07%
19.75%
90 to 100
1.13%
18.68%
101 to 150
3.90%
17.55%
151 to 200
2.77%
13.65%
201 to 250
1.70%
10.88%
251 to 300
0.94%
9.18%
301 to 350
1.01%
8.24%
351 to 400
0.38%
7.23%
401 to 450
0.63%
6.86%
451 to 500
0.69%
6.23%
501 to 1000
2.89%
5.53%
1001 to 10k
2.45%
2.64%
>10k
0.19%
0.19%
The New York Times
The New York Times has a high Domain Authority score: 95.
An average piece in the New York Times receives ~429k views on average.
A piece from the publication’s subscriber only newsletter The Amplifier was an outlier in terms of social shares, receiving nearly half a million shares. Incorporating the ‘push’ characteristics of a newsletter alongside other types of coverage can be beneficial for some campaigns as these communications methods can often lead to good open rates and engagement.
Nearly one in four items submitted to CoverageBook during 2024 from the New York Times did not receive social shares.
How many social shares of your coverage?
Out of 2,642 items in The New York Times, what % gets this many social shares?
If you get this you are in the top…
0 shares
24.79%
1 to 9
10.41%
75.21%
10 to 19
5.68%
64.80%
20 to 29
4.96%
59.12%
30 to 39
3.22%
54.16%
40 to 49
3.03%
50.95%
50 to 59
2.61%
47.92%
60 to 69
2.01%
45.31%
70 to 79
1.40%
43.30%
80 to 89
1.59%
41.90%
90 to 100
1.78%
40.31%
101 to 150
5.75%
38.53%
151 to 200
4.16%
32.78%
201 to 250
3.14%
28.61%
251 to 300
2.65%
25.47%
301 to 350
2.20%
22.82%
351 to 400
1.97%
20.63%
401 to 450
1.74%
18.66%
451 to 500
1.44%
16.92%
501 to 1000
7.08%
15.48%
1001 to 10k
7.57%
8.40%
>10k
0.83%
0.83%
Forbes
In our analysis of coverage from Forbes, we considered all languages. Our sample of ~14k items from Forbes was mainly from the English language part of the site (92%) followed by Spanish (5%). Other languages contributed a further 3%.
An article on Forbes receives on average ~114k views, items prompting higher engagement often performed better than this – typically 160k-190k views.
The main Forbes international website (Forbes.com) has a DA score of 94. Its Mexican site (Forbes.com.mx) has a DA of 88, the Brazilian site has a DA of 85. Forbesindia.com scores a DA of 82.
It is normal if your Forbes coverage doesn’t receive any social shares, this places you among the 60% of coverage which didn’t.
How many social shares of your coverage?
Out of 14,208 items in Forbes, what % gets this many social shares?
If you get this you are in the top…
0 shares
60.63%
1 to 9
16.58%
39.37%
10 to 19
6.10%
22.78%
20 to 29
3.98%
16.68%
30 to 39
2.67%
12.70%
40 to 49
1.80%
10.02%
50 to 59
1.34%
8.22%
60 to 69
1.06%
6.88%
70 to 79
0.76%
5.81%
80 to 89
0.63%
5.05%
90 to 100
0.45%
4.43%
101 to 150
1.35%
3.98%
151 to 200
0.67%
2.63%
201 to 250
0.37%
1.96%
251 to 300
0.28%
1.59%
301 to 350
0.20%
1.31%
351 to 400
0.14%
1.11%
401 to 450
0.12%
0.96%
451 to 500
0.07%
0.84%
501 to 1000
0.32%
0.77%
1001 to 10k
0.42%
0.46%
>10k
0.04%
0.04%
MSN
In our analysis of coverage from MSN, we considered all markets and languages. Our sample of 56,700 items from this website was mainly from the English language part of the site (83%) followed by Spanish (5%), German (3%), French and Arabic (both 2%). Other languages contributed a further 6%.
MSN often aggregates coverage from other news sources and republishes it onto its site.
Evidence of social shares of MSN content is negligible.
How many social shares of your coverage?
Out of 56,700 items on MSN (from all markets and languages submitted), what % gets this many social shares?
If you get this you are in the top…
0 shares
99.928%
1 to 9
0.049%
0.07%
10 to 19
0.005%
0.07%
20 to 29
0.012%
0.05%
30 to 39
0.002%
0.05%
40 to 49
0.000%
0.05%
50 to 59
0.000%
0.05%
60 to 69
0.002%
0.05%
70 to 79
0.000%
0.05%
80 to 89
0.000%
0.05%
90 to 100
0.000%
0.05%
101 to 150
0.000%
0.05%
151 to 200
0.000%
0.05%
201 to 250
0.000%
0.05%
251 to 300
0.000%
0.05%
301 to 350
0.000%
0.05%
351 to 400
0.000%
0.05%
401 to 450
0.000%
0.05%
451 to 500
0.002%
0.05%
501 to 1000
0.000%
0.05%
1001 to 10k
0.000%
0.05%
>10k
0.000%
0.05%
Yahoo!
In our analysis of coverage from Yahoo!, we considered all markets and languages. Our sample of ~80k items from this website was mainly from the English language part of the site (94%) followed by Spanish (2%), and French (1%). Other languages contributed a further 3%.
Different parts of the site perform better than others in terms of views – on average an English language piece from Yahoo! might lead to ~686k views, whereas a typical Spanish piece may only achieve ~33.3k views. A typical piece in French achieves 12.8k views, a German piece receives 4.4k views on average.
How many social shares of your coverage?
Out of 81,630 items on Yahoo (from all markets and languages submitted), what % gets this many social shares?
If you get this you are in the top…
0 shares
96.33%
1 to 9
2.90%
3.67%
10 to 19
0.23%
0.77%
20 to 29
0.12%
0.54%
30 to 39
0.08%
0.42%
40 to 49
0.04%
0.34%
50 to 59
0.04%
0.31%
60 to 69
0.02%
0.26%
70 to 79
0.02%
0.24%
80 to 89
0.01%
0.22%
90 to 100
0.01%
0.21%
101 to 150
0.04%
0.20%
151 to 200
0.04%
0.16%
201 to 250
0.02%
0.12%
251 to 300
0.01%
0.10%
301 to 350
0.01%
0.09%
351 to 400
0.00%
0.08%
401 to 450
0.01%
0.08%
451 to 500
0.01%
0.07%
501 to 1000
0.02%
0.06%
1001 to 10k
0.04%
0.04%
>10k
0.005%
0.005%
When reviewing the data above, please take these considerations into account:
These high reach, high Domain Authority outlets are among the most prolific (generating the most volume) in our data archive for 2024.
Our data crunchers only saw the URL and CoverageBook’s associated data points: Domain Authority, Estimated Coverage Views and total social shares. No personal or private data linking coverage with the customer was shared.
URL structure can be indicative of the segment of the site where the article was published; this guided our analysis into which segments of certain sites attract the most engagement.
The URLs submitted to CoverageBook are likely to be proactively generated coverage which PR teams are proudly reporting on.
We omitted homepage URLs from our calculations when working out average social shares, so as not to skew the data.
We encourage our customers to upload specific URLs for coverage to get the best data available at an article level – even though the article might have briefly featured on the home page, it has its own unique URL which informs our audience metrics.
In summary, these types of deep dives at a publication level provide you with more granular data to inform your internal stakeholders how well specific data points at an article level measure up against our benchmarks. It can provide you with context as to why you may not be seeing evidence of social engagement on some pieces of coverage, and can guide you when setting targets for earned media engagement.
Our next blog post will take a slightly broader look, focusing on consumer-facing and trade outlets by industry (eg fashion, health, tech etc), It may be that the data shows us how targeting niche and specific mid tier titles, even if they have a lower DA than the outlets featured here, can generate good reach and audience engagement. Watch this space…
Steph is the founder of Experienced Media Analysts, an award-winning media insight Consultancy and board member of the International Association for the Measurement and Evaluation of Communication - AMEC.